
Nine different venues will host matches in the 2024 T20 World Cup across the USA and the Caribbean. Here's all you need to know about every venue, including capacity, boundary dimension and records.
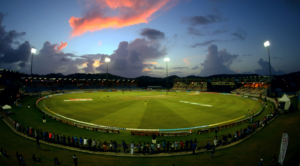
Sir Vivian Richards Stadium, Antigua & Barbuda
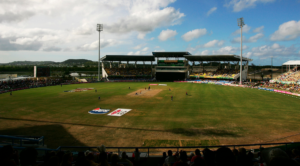
Capacity: 10,000
Number of T20Is played: 13
Average score batting first: 138
Highest team innings: 190-5 Canada (v Bahamas, 2021)
Highest score chased: 131-2 West Indies (v Zimbabwe, 2013)
Batting first won: 9
Batting second won: 4
Average runs per over: 6.86
Average runs per wicket: 18.34
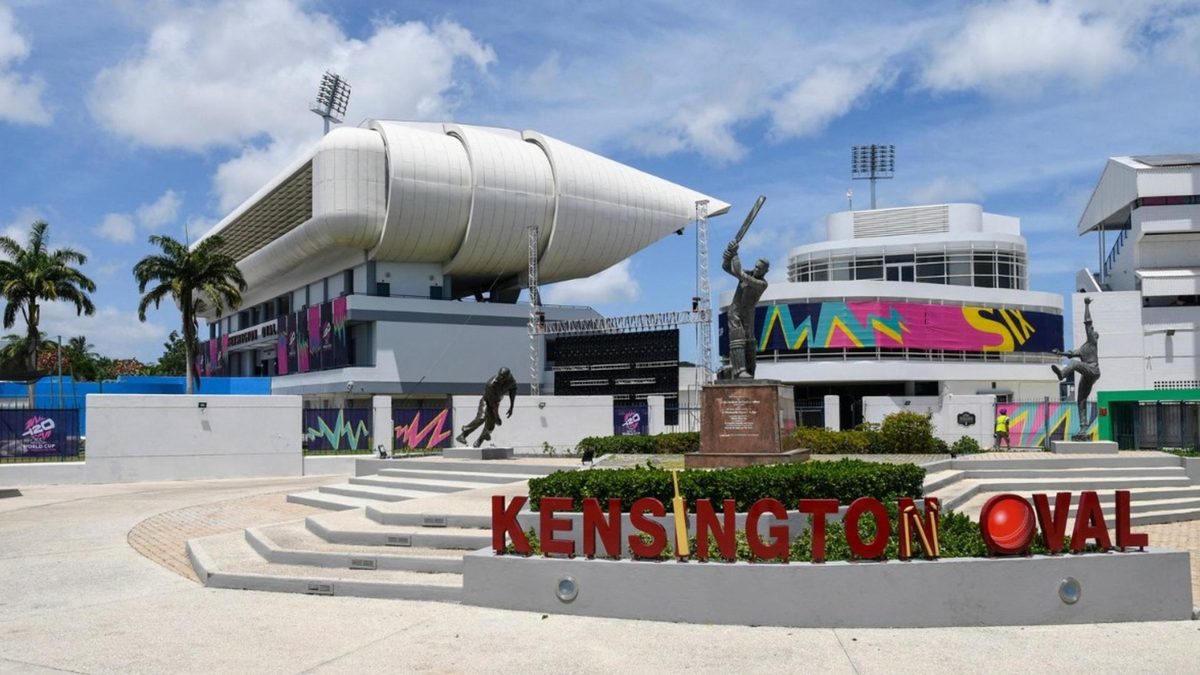
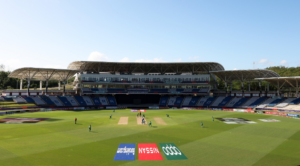
Kensington Oval, Barbados
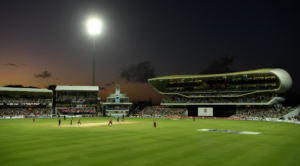
Capacity: 28,000
Number of T20Is played: 24
Average score batting first: 156
Highest team innings: 224-5 West Indies (v England, 2022)
Highest score chased: 172-6 West Indies (v England, 2023)
Batting first won: 16
Batting second won: 7
Average runs per over: 7.88
Average runs per wicket: 22.1o
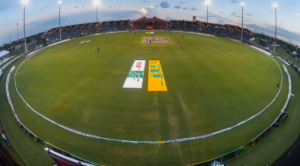
Providence Stadium, Guyana
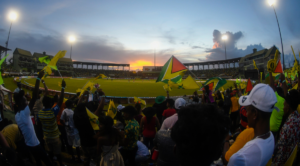
Capacity: 20,000
Number of T20Is played: 13
Average score batting first: 128
Highest team innings: 191-5 England (v West Indies, 2010)
Highest score chased: 169-5 West Indies (v Bangladesh, 2022)
Batting first won: 3
Batting second won: 7
Average runs per over: 7.51
Average runs per wicket: 22.93
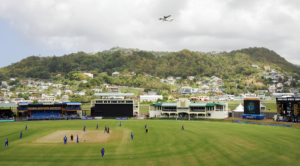
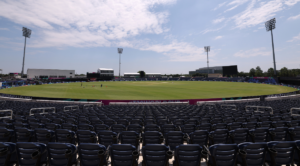
Daren Sammy Cricket Ground, Saint Lucia
Capacity: 15,000
Number of T20Is played: 18
Average score batting first: 160
Highest team innings: 199-8 West Indies (vs Australia, 2021)
Highest score chased: 197-7 Australia (v Pakistan, 2010)
Batting first won: 9
Batting second won: 9
Average runs per over: 8.09
Average runs per wicket: 24.15
Arnos Vale Stadium, St. Vincent & the Grenadines
Capacity: 18,000
Number of T20Is played: 2
Average score batting first: 144
Highest team innings: 158-8 Pakistan (v West Indies, 2013)
Highest score chased: 158-8 Pakistan (v West Indies, 2013)
Batting first won: 1
Batting second won: 1
Average runs per over: 7.11
Average runs per wicket: 18.35
Brian Lara Cricket Academy, Trinidad & Tobago
Capacity: 15,000
Number of T20Is played: 4
Average score batting first: 185
Highest team innings: 267-3 England v (West Indies, 2023)
Highest score chased: 133-6 West Indies (v England, 2023)
Batting first won: 3
Batting second won: 1
Average runs per over: 8.62
Average runs per wicket: 22.93
Queen's Park Oval, Trinidad & Tobago
Capacity: 20,000
Number of T20Is played: 6
Average score batting first: 130
Highest team innings: 159-6 India (v West Indies, 2011)
Highest score chased:138-3 West Indies (v Pakistan, 2017)
Batting first won: 3
Batting second won: 3
Average runs per over: 6.57
Average runs per wicket: 18.06
Central Broward Park, Florida
Capacity: 25,000
Number of T20Is played: 16
Average score batting first: 166
Highest team innings: 245-6 West Indies (v India, 2016)
Highest score chased: 179-1 India (v West Indies, 2023)
Batting first won: 11
Batting second won: 4
Average runs per over: 8.02
Average runs per wicket: 22.75
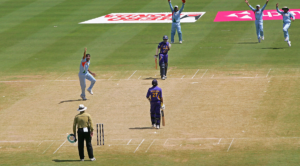
Nassau County International Cricket Stadium, New York
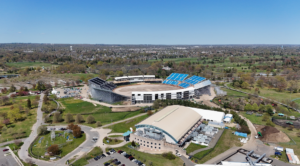
Capacity: 34,000
Number of T20Is played: 0
Average score batting first: N/A
Highest team innings: N/A
Highest score chased: N/A
Batting first won: N/A
Batting second won: N/A
Average runs per over: N/A
Average runs per wicket: N/A
Grand Prairie Stadium, Texas
Capacity: 15,000
Number of T20Is played: 7
Average score batting first: 136
Highest team innings: 230-3
Highest score chased: 169-6
Batting first won: 3
Batting second won: 4
Average runs per over: 7.99
Average runs per wicket: 24.86
Subscribe to the Wisden Cricket YouTube channel for post-match analysis, player interviews, and much more.


