
The 2023 ICC Cricket World Cup will be played across 10 Indian venues. Here is all you need to know about the ten World Cup venues, including their capacity, boundary dimensions, spin vs pace records, and much more.
Subscribe to the Wisden Cricket YouTube channel for post-match analysis, player interviews, and much more.
*Numbers represent ODI data since 2016
Narendra Modi Stadium, Ahmedabad
[caption id=”attachment_581201″ align=”alignnone” width=”1024″]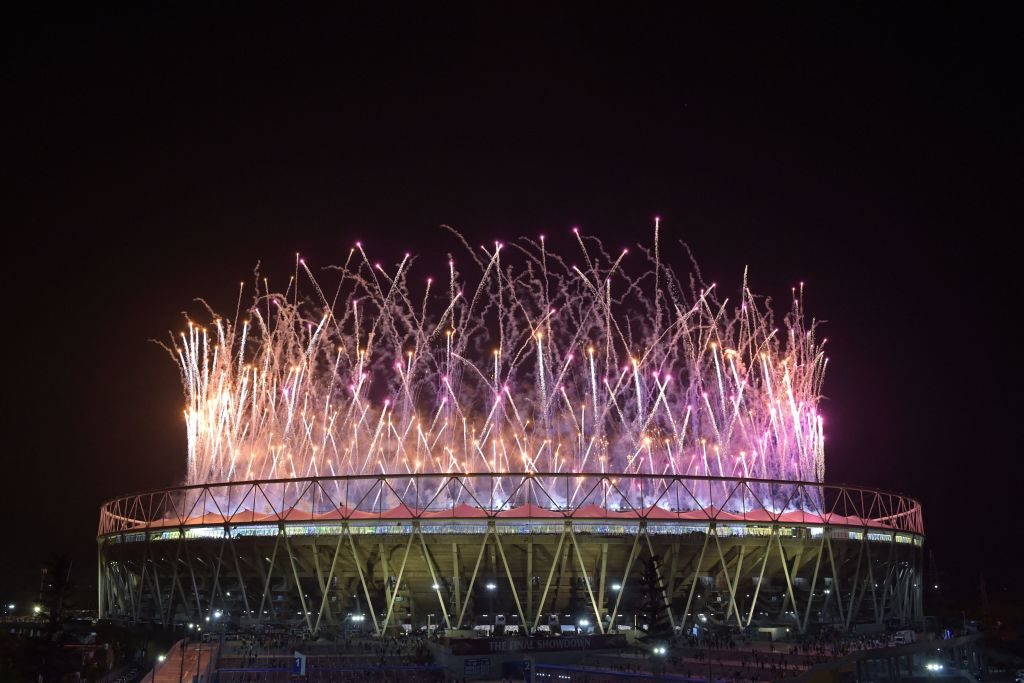 Narendra Modi Stadium, Ahmedabad[/caption]
Capacity: 132,000
Boundary dimensions: Straight – 75m (average), Squares – 60-65m (average)
Number of pitches: 11
Number of ODIs played: 3
Average score batting 1st: 226
Highest score chased: 176 by IND vs WI
Batting first won: 2/3 = 67%
Batting second won: 1/3 = 33%
Spinners at this venue: Average 27.44, Economy Rate 5.20, Wickets 18 = 35.29%
Seamers at this venue: Average 21.30, Economy Rate 4.38, Wickets 33 = 64.7%
Verdict: Not a lot of ODIs have been played at the new stadium. The three ODIs that were, witnessed low scores. In the IPL, new-ball bowlers have found appreciable movement and carry here, though with so many pitches available, it is difficult to predict what sort of surface will be on offer on a particular day.
Arun Jaitley Stadium, Delhi
[caption id=”attachment_581198″ align=”alignnone” width=”1024″]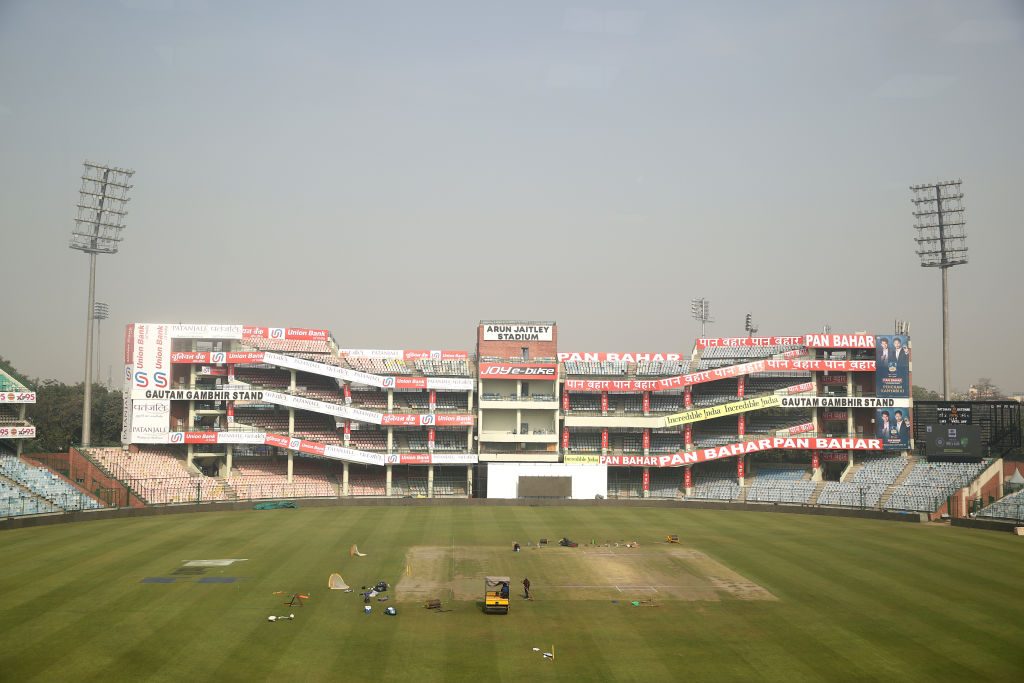 Arun Jaitley Stadium, Delhi[/caption]
Capacity: 37,500
Boundary dimensions: Straight – 68-70m (average), Squares – 65m (average)
Number of pitches: 9
Number of ODIs played: 3
Average score batting 1st: 204
Highest score chased: 99 by IND vs SA
Batting first won: 2/3 = 67%
Batting second won: 1/3 = 33%
Spinners at this venue: Average 22.87, Economy Rate 5.07, Wickets 24 = 50%
Seamers at this venue: Average 25.91, Economy Rate 4.51, Wickets 24 = 50%
Verdict: The Delhi surface is typically low and slow. In the last ODI that was played here, South Africa were all out for 99 thanks to a five-for by Mohammed Siraj. Despite that, spinners have averaged less than pacers here in the last three ODIs.
HPCA Cricket Stadium, Dharamsala
[caption id=”attachment_581206″ align=”alignnone” width=”1024″]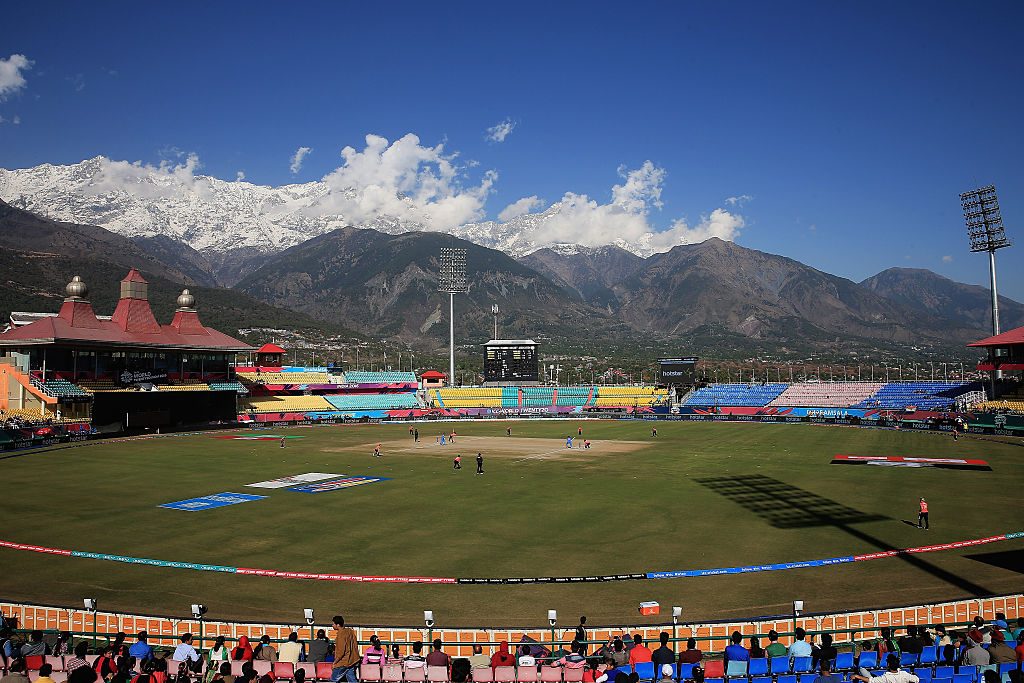 HPCA Stadium, Dharamsala[/caption]
Capacity: 23,000
Boundary dimensions: Straight – 68-70m (average), Squares – 63-65m (average)
Number of pitches: 9
Number of ODIs played: 2
Average score batting 1st: 151
Highest score chased: 190 by IND vs NZ
Batting first won: 0/2 = 0%
Batting second won: 2/2 = 100%
Spinners at this venue: Average 21.37, Economy Rate 4.27, Wickets 8 = 30.76%
Seamers at this venue: Average 24, Economy Rate 4.50, Wickets 18 = 69.23%
Verdict: The ball generally flies off the bat on this ground, which is located 1,456m above sea level. Seamers get decent help, and can make batting difficult, but the conditions seldom aid spin. The good numbers for spinners above are primarily due to seamers inducing top-order collapses and spinners cleaning up the tail.
Ekana Stadium, Lucknow
[caption id=”attachment_581214″ align=”alignnone” width=”1024″]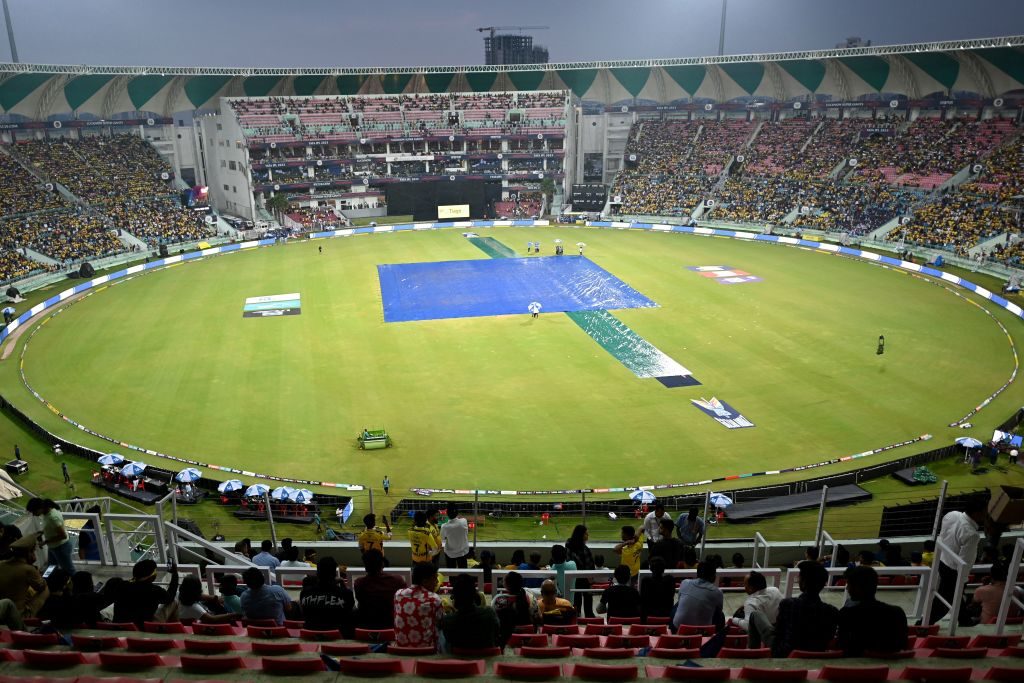 Ekana Stadium, Lucknow[/caption]
Capacity: 50,000
Boundary dimensions: Straight – 68-70m (average), Squares – 63-65m (average)
Number of pitches: Unclear
Number of ODIs played: 4
Average score batting 1st: 226
Highest score chased: 249 by WI vs AFG
Batting first won: 2/4 = 50%
Batting second won: 2/4 = 50%
Spinners at this venue: Average 36.50, Economy Rate 4.76, Wickets 26 = 50%
Seamers at this venue: Average 32.76, Economy Rate 5.04, Wickets 26 = 50%
Verdict: Lucknow is notorious for being extremely low, slow, and spin-friendly, but the square also contains some flat pitches that saw huge scores at the IPL. Seamers who are good at taking pace off will love to bowl at this venue. This is expected to be one of the toughest venues for batting at this World Cup.
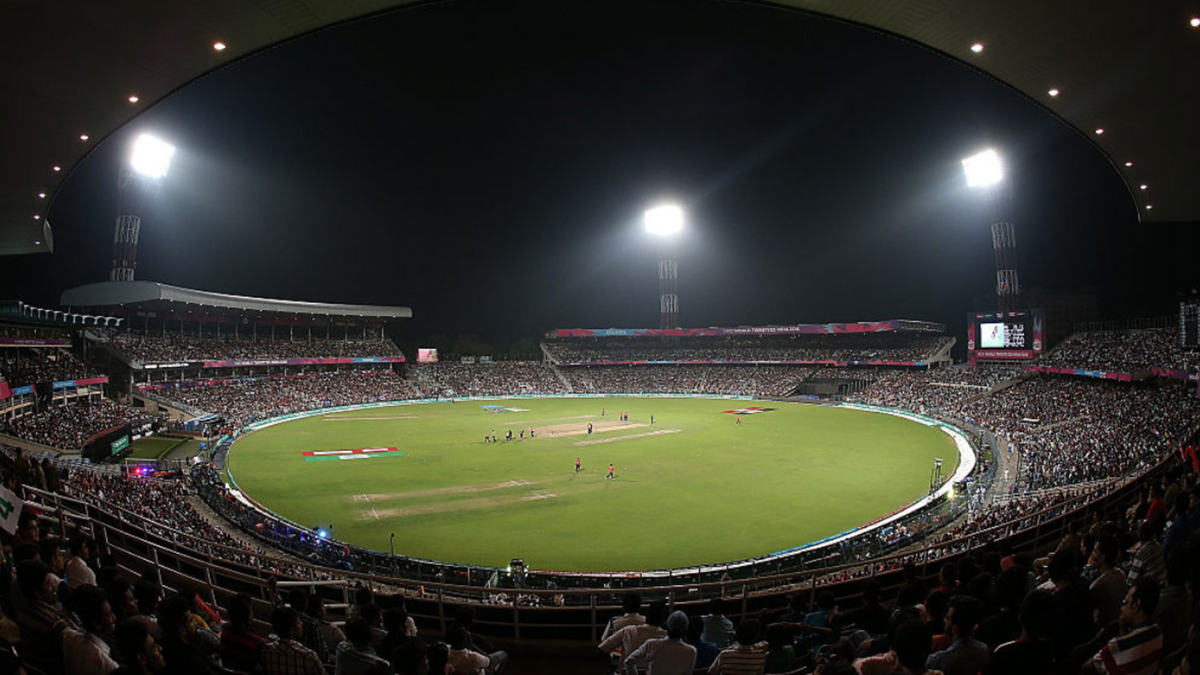
Eden Gardens, Kolkata
[caption id=”attachment_581220″ align=”alignnone” width=”1024″]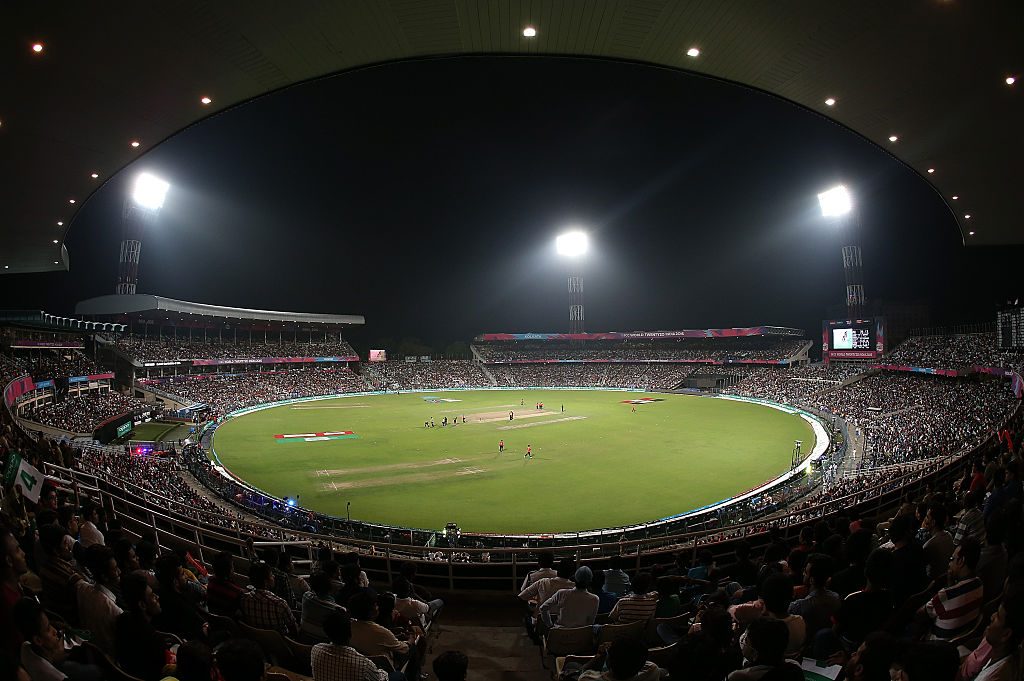 Eden Gardens, Kolkata[/caption]
Capacity: 68,000
Boundary dimensions: Straight – 64-71m (average), Squares – 65-69m (average)
Number of pitches: Unclear
Number of ODIs played: 3
Average score batting 1st: 262
Highest score chased: 215 by IND vs SL
Batting first won: 2/3 = 67%
Batting second won: 1/3 = 33%
Spinners at this venue: Average 34.53, Economy Rate 4.93, Wickets 13 = 27.08%
Seamers at this venue: Average 29.82, Economy Rate 5.63, Wickets 35 = 72.92%
Verdict: What used to be a low, slow surface on which the Kolkata Knight Riders built their success between 2012 and 2014 has completely transformed into a quick, flat deck that assists more pace than spin. Coupled with the extremely fast outfields, it can be one of the highest-scoring venues at the World Cup – though batting sides need to watch out for that breeze that blows across the ground around sunset.
Wankhede Stadium, Mumbai
[caption id=”attachment_581229″ align=”alignnone” width=”1024″]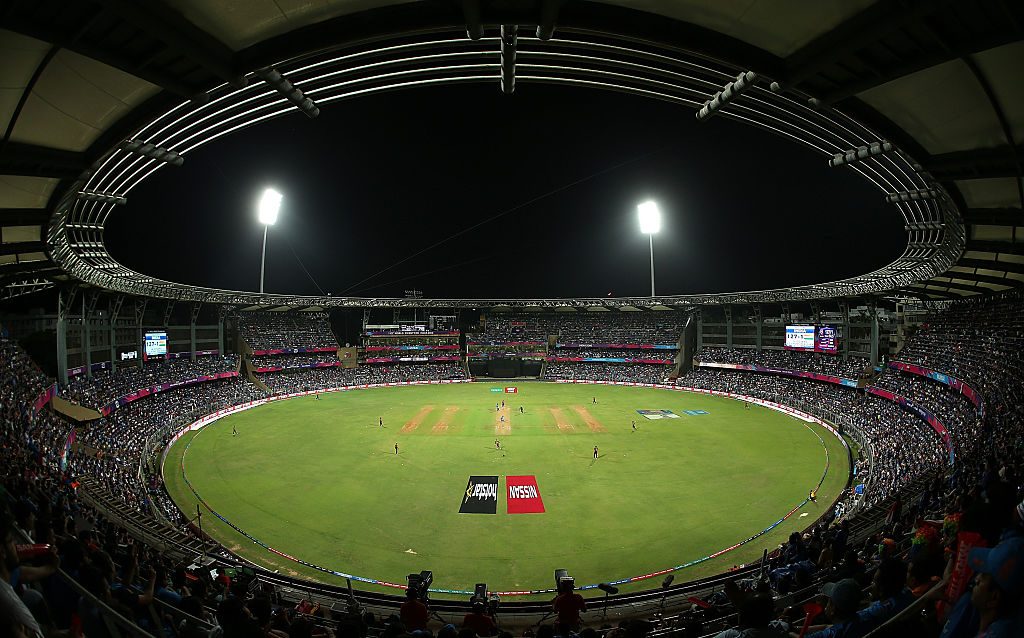 Wankhede Stadium, Mumbai[/caption]
Capacity: 32,000
Boundary dimensions: Straight – 68-72m (average), Squares – 64-66m (average)
Number of pitches: Unclear
Number of ODIs played: 3
Average score batting 1st: 241
Highest score chased: 280 by NZ vs IND
Batting first won: 0/3 = 0%
Batting second won: 3/3 = 100%
Spinners at this venue: Average 71.28, Economy Rate 5.36, Wickets 7 = 18.42%
Seamers at this venue: Average 31.58, Economy Rate 5.44, Wickets 29 = 81.58%
Verdict: Wankhede can be a difficult venue to crack, for it generally has something for everyone. Seamers get good bounce and carry and, under lights and with the sea breeze, appreciable movement as well. Spinners can run through oppositions on their days. The Chennai Super Kings have implemented their famous middle-overs spin choke of late here. The short boundaries and good bounce – a product of the red soil – produces more value for shots compared to some other venues.
MCA International Stadium, Pune
[caption id=”attachment_581237″ align=”alignnone” width=”1200″]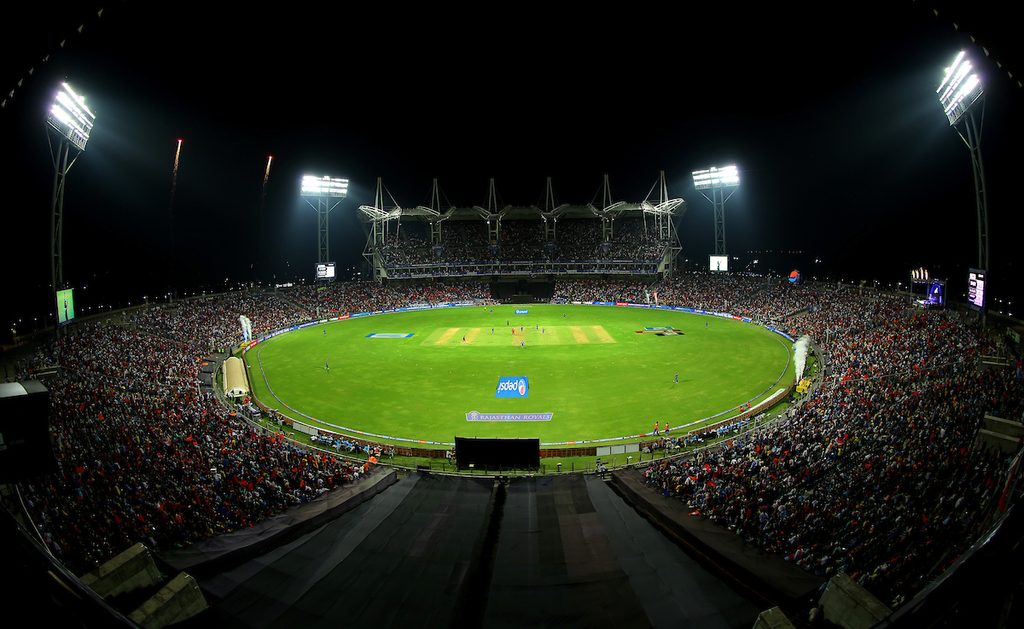 MCA International Stadium, Pune[/caption]
Capacity: 36,400
Boundary dimensions: Straight – 72-74m (average), Squares – 65m (average)
Number of pitches: Unclear
Number of ODIs played: 6
Average score batting 1st: 307
Highest score chased: 350 by IND vs ENG
Batting first won: 3/6 = 50%
Batting second won: 3/6 = 50%
Spinners at this venue: Average 68.52, Economy Rate 6.23, Wickets 19 = 21.83%
Seamers at this venue: Average 32.82, Economy Rate 6.08, Wickets 68 = 78.17%
Verdict: Pune is going to be one of the fastest-scoring venues at the World Cup. A spinners’ graveyard with some help for seamers, but mostly a flat highway where batters can feast upon.
M Chinnaswamy Stadium, Bengaluru
[caption id=”attachment_581241″ align=”alignnone” width=”1024″]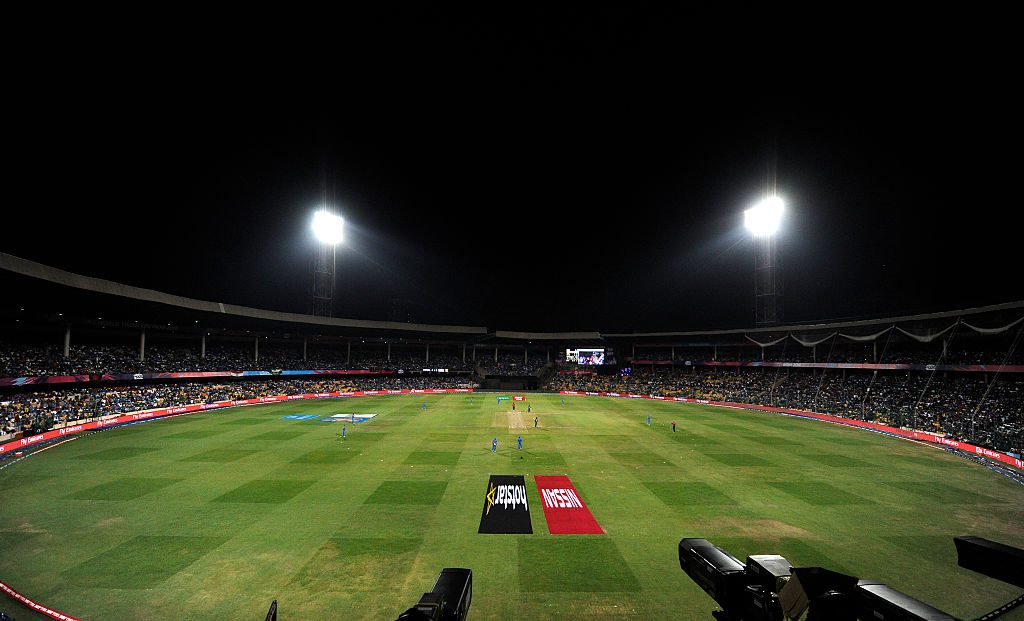 M Chinnaswamy Stadium, Bengaluru[/caption]
Capacity: 40,000
Boundary dimensions: Straight – 65m (average), Squares – 55-60m (average)
Number of pitches: 4
Number of ODIs played: 2
Average score batting 1st: 310
Highest score chased: 286 by IND vs AUS
Batting first won: 1/2 = 50%
Batting second won: 1/2 – 50%
Spinners at this venue: Average 66.85, Economy Rate 5.69, Wickets 7 = 30.43%
Seamers at this venue: Average 45.18, Economy Rate 6.26, Wickets 16 = 69.57%
Verdict: Short boundaries and high altitude have made Bengaluru a high-scoring ground. There’s not enough ODI data to draw conclusions from in the last seven years, but teams prefer chasing here in the IPL. The numbers may suggest otherwise, but on particular pitches on the square, spinners can get some purchase to make the contest between bat and ball slightly even.
MA Chidambaram Stadium, Chennai
[caption id=”attachment_581246″ align=”alignnone” width=”1024″]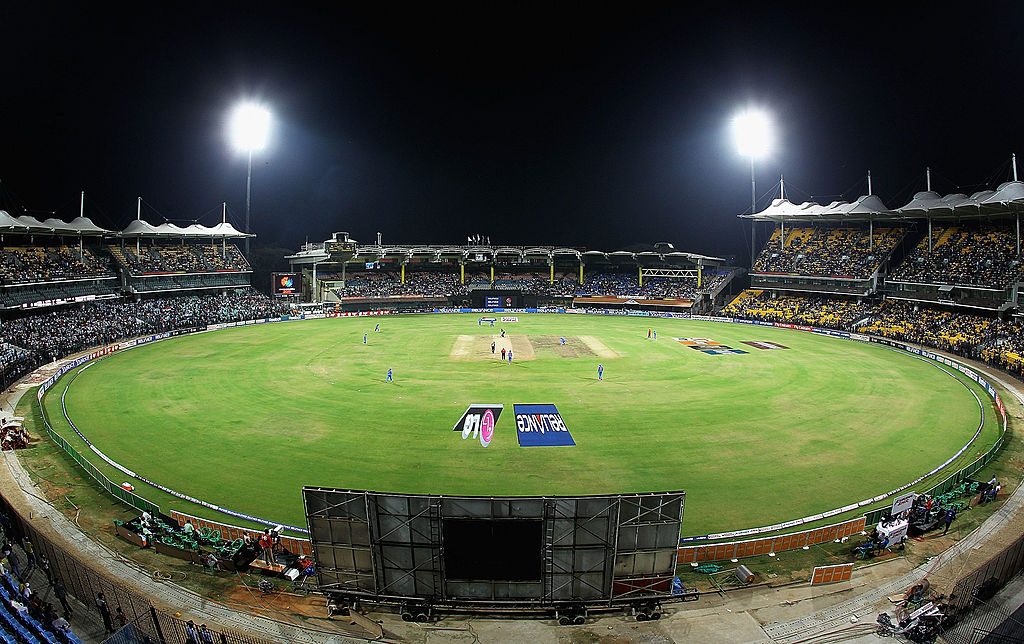 MA Chidambaram Stadium, Chennai[/caption]
Capacity: 50,000
Boundary dimensions: Straight – 65m (average), Squares – 68m (average)
Number of pitches: 9
Number of ODIs played: 3
Average score batting 1st: 279
Highest score chased: 287 by WI vs IND
Batting first won: 2/3 = 67%
Batting second won: 1/3 = 33%
Spinners at this venue: Average 32.39, Economy Rate 5.49, Wickets 17 = 39.53%
Seamers at this venue: Average 36.03, Economy Rate 5.61, Wickets 26 = 60.47%
Verdict: Chennai will be one of the spin-friendliest venues at this World Cup. Contrary to myth, scoring is not difficult here. Spinners have been more effective than pacers, but runs are also come at a decent rate. There were high scores at this year’s IPL. Even the last three ODIs have witnessed an average first innings score of nearly 280.
Rajiv Gandhi International Stadium, Hyderabad
[caption id=”attachment_581254″ align=”alignnone” width=”1024″]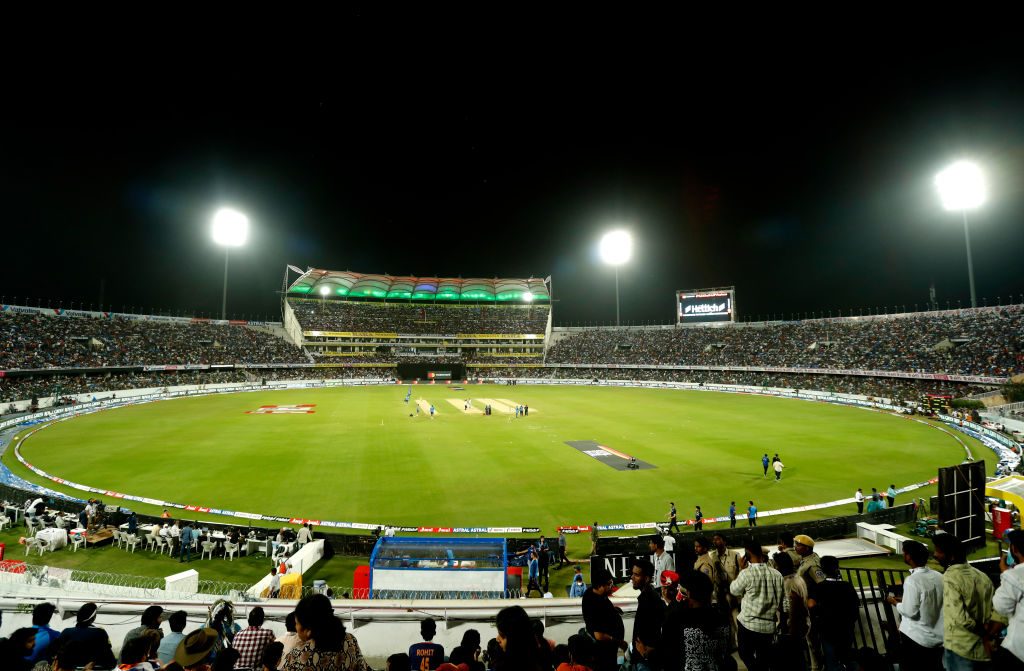 Rajiv Gandhi International Stadium, Hyderabad[/caption]
Capacity: 55,000
Boundary dimensions: Straight – 65-70m (average), Squares – 66-69m (average)
Number of pitches: Unclear
Number of ODIs played: 2
Average score batting 1st: 292
Highest score chased: 236 by IND vs AUS
Batting first won: 1/2 = 50%
Batting second won: 1/2 = 50%
Spinners at this venue: Average 43.87, Economy Rate 5.16, Wickets 8 = 28.57%
Seamers at this venue: Average 40.25, Economy Rate 6.20, Wickets 20 = 71.43%
Verdict: Hyderabad has generally been a high-scoring ground. A target of 350 nearly got chased during an India-New Zealand ODI earlier this year, while New Zealand surpassed a similar target in their warm-up game against Pakistan.Spinners and pacers both average in excess of 40 across the two ODIs here since 2019. IPL 2023 also saw high scores being put up at this venue. Teams will prefer chasing here.


